VeRoViz is a suite of tools designed for vehicle routing researchers by vehicle routing researchers.
Originally developed for use in the Optimator Lab at the University at Buffalo, VeRoViz is now available to the larger research community as an open-source project.
Ready to get started?
- Visit the Installation Guide, which has detailed instructions for installing VeRoViz.
- There are also many examples which highlight some of the features of VeRoViz.
- Check out our working paper on SSRN to read an overview of VeRoViz, along with some example code.
How does it work?
VeRoViz is designed to work with your existing workflow. For example, many vehicle routing researchers follow these steps:
1. Generate test instances
The first step is typically to create "nodes" (locations on a map).
Start by importing the Python library:
import veroviz as vrvSketch makes it easy to define a boundary area, within which we'll generate nodes:
We'll copy the boundary coordinates from Sketch into our Python code:
myBoundary = [[42.914949262700084, -78.90020370483398],
              [42.871938424448466, -78.89556884765626],
              [42.875083507773496, -78.82158279418947],
              [42.912937728596240, -78.81729125976564]]
Now we'll generate some nodes for our problem, making sure that each node is located on a road. We'll start with one depot node (shown with a red "home" icon), and then add four customer nodes (with blue "star" icons). These nodes will be uniformly distributed over the boundary region:
# Create a single depot node:
nodesDF = vrv.generateNodes(numNodes         = 1,
                            startNode        = 0,
                            nodeType         = 'depot',
                            leafletColor     = 'red',
                            leafletIconType  = 'home',
                            nodeDistrib      = 'uniformBB',
                            nodeDistribArgs  = {
                                   'boundingRegion': myBoundary },
                            dataProvider     = 'OSRM-online',
                            snapToRoad       = True)

# Create four customer nodes:
nodesDF = vrv.generateNodes(initNodes       = nodesDF,
                            numNodes        = 4,
                            startNode       = 1,
                            nodeType        = 'customer',
                            leafletColor    = 'blue',
                            leafletIconType = 'star',
                            nodeDistrib     = 'uniformBB',
                            nodeDistribArgs = {
                                   'boundingRegion': myBoundary },
                            dataProvider    = 'OSRM-online',
                            snapToRoad      = True)
Let's take a look at our nodes and bounding region on a Leaflet map:
vrv.createLeaflet(nodes=nodesDF, boundingRegion=myBoundary)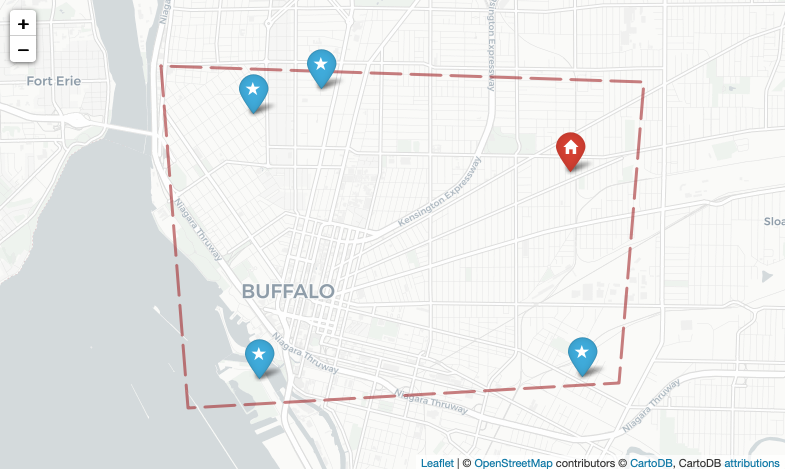
These functions have many more options that weren't shown here. Check out the documentation for the generateNodes() and createLeaflet() functions.
2. Create travel matrices
You'll probably want to know the distance and/or time to travel between each pair of nodes. VeRoViz makes this easy:
[time, dist] = vrv.getTimeDist2D(nodes        = nodesDF,
                                 matrixType   = 'all2all',
                                 routeType    = 'fastest',
                                 dataProvider = 'OSRM-online')
This returns two square dictionaries containing the following data:
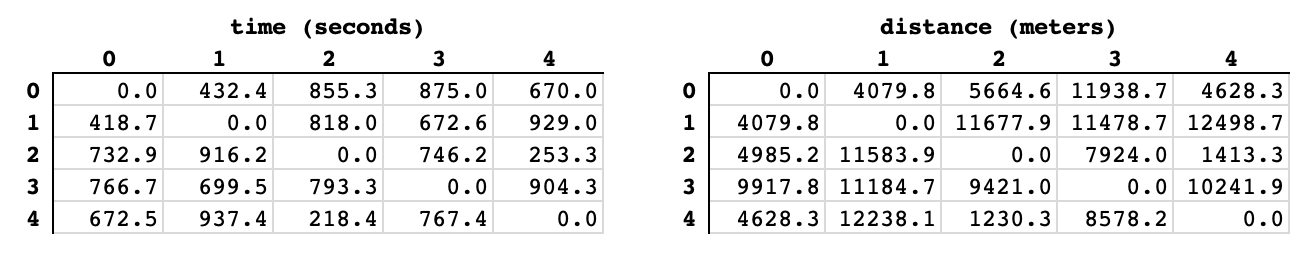
The documentation for the getTimeDist2D() function describes the many additional options that VeRoViz provides. There's also a 3D form of the function, getTimeDist3D(), that is designed for flying vehicles (like drones).
3. Generate a solution
VeRoViz isn't a solver. So, this step is where you apply your vehicle routing expertise to construct a solution to this problem.
For the sake of demonstrating VeRoViz, the following function provides some simple routes for a truck and a drone that deliver packages to the nodes. The function returns an "assignments" dataframe, which describes the detailed movements of each vehicle over time.
def dummySolver(nodesDF, dist, time):
    import pandas as pd

    # Assume truck travels depot -> 1 -> 2 -> depot
    # Assume drone travel depot -> 3 -> depot -> 4 -> depot
    route = {'truck': [0, 1, 2, 0],
             'drone': [0, 3, 0, 4, 0]}

    configs = {'truck': {
                 'vehicleModels': ['veroviz/models/ub_truck.gltf'],
                 'leafletColor': 'blue',
                 'cesiumColor': 'Cesium.Color.BLUE',
                 'packageModel': 'veroviz/models/box_blue.gltf'},
               'drone': {'vehicleModels': ['veroviz/models/drone.gltf',
                                   'veroviz/models/drone_package.gltf'],
                 'leafletColor': 'orange',
                 'cesiumColor': 'Cesium.Color.ORANGE',
                 'packageModel': 'veroviz/models/box_yellow.gltf'}}

    # Specify a duration for each vehicle to stop at each node.
    serviceTime = 30     # seconds

    # Initialize an empty "assignments" dataframe.
    assignmentsDF = vrv.initDataframe('assignments')

    for vehicle in route:
        startTime = 0
        for i in list(range(0, len(route[vehicle])-1)):
            startNode = route[vehicle][i]
            endNode   = route[vehicle][i+1]

            startLat = nodesDF[nodesDF['id'] == startNode]['lat'].values[0]
            startLon = nodesDF[nodesDF['id'] == startNode]['lon'].values[0]
            endLat   = nodesDF[nodesDF['id'] == endNode]['lat'].values[0]
            endLon   = nodesDF[nodesDF['id'] == endNode]['lon'].values[0]

            if ((vehicle == 'drone') and (startNode == 0)):
                # Use the 3D model of a drone carrying a package
                myModel = configs[vehicle]['vehicleModels'][1]
            else:
                # Use the 3D model of either a delivery truck or an empty drone
                myModel = configs[vehicle]['vehicleModels'][0]

            if (vehicle == 'truck'):
                # Get turn-by-turn navigation
                # for the truck on the road:
                shapepointsDF = vrv.getShapepoints2D(
                    objectID         = vehicle,
                    modelFile        = myModel,
                    startTimeSec     = startTime,
                    startLoc         = [startLat, startLon],
                    endLoc           = [endLat, endLon],
                    routeType        = 'fastest',
                    leafletColor     = configs[vehicle]['leafletColor'],
                    cesiumColor      = configs[vehicle]['cesiumColor'],
                    dataProvider     = 'OSRM-online')
            else:
                # Get a 3D flight profile for the drone:
                shapepointsDF = vrv.getShapepoints3D(
                    objectID           = vehicle,
                    modelFile          = myModel,
                    startTimeSec       = startTime,
                    startLoc           = [startLat, startLon],
                    endLoc             = [endLat, endLon],
                    takeoffSpeedMPS    = 5,
                    cruiseSpeedMPS     = 20,
                    landSpeedMPS       = 3,
                    cruiseAltMetersAGL = 100,
                    routeType          = 'square',
                    cesiumColor        = configs[vehicle]['cesiumColor'])

            # Add the vehicle movement to the assignments dataframe:
            assignmentsDF = pd.concat([assignmentsDF, shapepointsDF],
                                      ignore_index=True, sort=False)

            # Update the time
            startTime = max(shapepointsDF['endTimeSec'])

            # Add loitering for service
            assignmentsDF = vrv.addStaticAssignment(
                initAssignments = assignmentsDF,
                objectID        = vehicle,
                modelFile       = myModel,
                loc             = [endLat, endLon],
                startTimeSec    = startTime,
                endTimeSec      = startTime + serviceTime)

            # Update the time again
            startTime = startTime + serviceTime

            # Leave a package at all non-depot nodes:
            if (endNode != 0):
                assignmentsDF = vrv.addStaticAssignment(
                    initAssignments = assignmentsDF,
                    objectID        = 'package %d' % endNode,
                    modelFile       = configs[vehicle]['packageModel'],
                    loc             = [endLat, endLon],
                    startTimeSec    = startTime,
                    endTimeSec      = -1)

    return assignmentsDF
It's now time to call our "dummy" solver to get a sample solution:
assignmentsDF = dummySolver(nodesDF, dist, time)Although VeRoViz doesn't have a vehicle routing solver engine, it is designed to help you visualize your solution. That happens in the next step.
4. Visualize the solution
One of the key features of VeRoViz is the ability to easily generate visual representations of vehicle routing solutions.
Using the solution provided by our "dummy" solver, let's create a Leaflet map showing the nodes and the routes:
vrv.createLeaflet(nodes=nodesDF, arcs=assignmentsDF)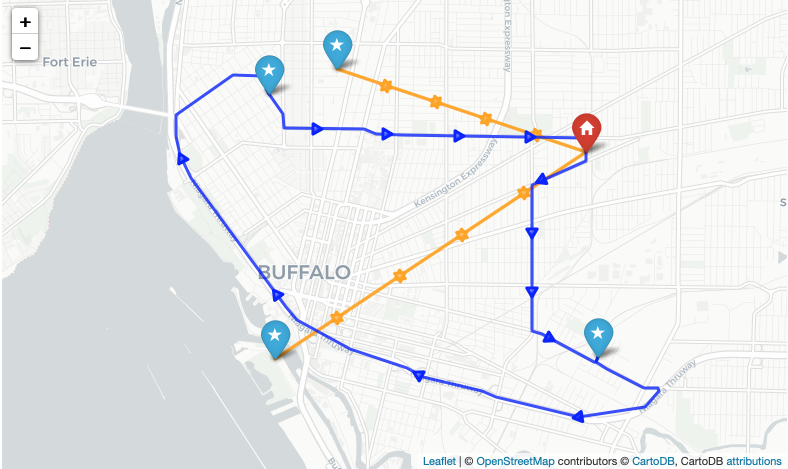
The Leaflet map gives a good overview of the routes. However, it doesn't convey a sense of timing.
VeRoViz provides a function to generate "movies" of vehicle routes displayed on a 3D map. This is done with the help of Cesium. Our movie will show the nodes, routes, and package deliveries over time:
vrv.createCesium(assignments = assignmentsDF,
                 nodes       = nodesDF,
                 startTime   = '10:00:00',
                 cesiumDir   = '/home/user/cesium',
                 problemDir  = 'homepage_demo')
To really appreciate the power of Cesium, we encourage you to interact with the Cesium demo.
That's it; just a few lines of code to create test instances, gather travel time information, and view solutions. The Jupyter notebook used to create this example is available for download.
Ready to Get Started?
- Use Sketch to create an example
- Install VeRoViz
- Read the Documentation
- View Tutorials and Examples
News
Version 0.4.6 was released today. Fixed issues caused by newer versions of Pandas and Numpy. Upgraded the Cesium Viewer for current version of Cesium. Mostly, we made VeRoViz usable again.
Sept. 15, 2025
Version 0.4.5 was released today. Added "minutely" weather forecast data as output from `getWeather()` function, and fixed a bug where some output data were being nested as dictionaries in a column.
Apr. 2, 2021
Version 0.4.4 was released today. This fixed a bug in the `createAssignmentsFromNodeSeq2D()` function where 'wheelchair', 'pedestrian', and 'cycling' routeType options were not working properly.
Feb. 17, 2021
Version 0.4.3 was released today.This includes several new utility functions, as well as some bug fixes.
Dec. 29, 2020
An updated version of the VeRoViz Cesium Viewer Plugin (2020.10.23) is now available.
Oct. 23, 2020
Version 0.4.2 was released today. This includes some minor bug fixes related to the `createCesium()` and `createArcsFromNodeSeq()` functions.
July 27, 2020
Version 0.4.1 was released today. Added `nearestNodes()` function to utilities, which finds k nearest nodes (based on either time or distance) from a given node or location. Fixed bug associated with gathering road information when querying ORS (both online and local) for shapepoint info. Moved `initDataframe()`, `exportDataframe()`, `getMapBoundary()`, `convertDistance()`, `convertSpeed()`, and `convertTime()` to private functions within `_utilities.py`; pointed to these private functions when validation was not required. Added new function, `setGlobal()`, to facilitate setting of global config values.
June 18, 2020
Version 0.4.0 was released today. This major release focused on adding new data (including elevation and weather), and adding new functions.
May 1, 2020
A new version of the VeRoViz Cesium Viewer Plugin (2020.04.30) is now available. This update references a newer version of Cesium (1.68) and also adds the ability to toggle visibility of node "pins" on the map. This is especially helpful if you have lots of nodes! Download the new plugin here.
Apr. 30, 2020
A new version of the VeRoViz Cesium Viewer Plugin (2019.11.12) is now available. This update is required, as it now uses version 1.63.1 of Cesium. The old plugin linked to a version of Cesium that now appears to be unsupported.
Nov. 12, 2019
Version 0.3.1 was released today. Numerous new functions were added, including functions for geocoding, reverse geocoding, faster generation of assignments dataframes, and finding vehicle locations at specific times.
Nov. 12, 2019
Version 0.2.2 was released today. Corrected error in createCesium() function that occurred if only stationary objects were added (no nodes).
Oct. 19, 2019
Well, that didn't take long. Version 0.2.1 was released today. Found (and corrected) a minor bug buried in the comments which was causing installation issues for some users.
Oct. 15, 2019
VeRoViz is live! Today marks the official release of version 0.2.0. Stay tuned for more info.
Oct. 14, 2019

© 2018-2025 optimatorlab
© 2018-2025 optimatorlab